
The Reverse Beacon Network is a global array of software-defined radio receivers — “skimmers” — continuously scanning the HF bands and reporting every CW, RTTY, and FT8 signal they hear. Unlike a traditional spotting network driven by human operators, the RBN runs 24/7 and produces thousands of automated spots per hour.
That firehose of data contains something tremendously useful: a real-time picture of which paths on which bands are actually carrying RF right now. The RBN S-Meter extracts exactly that picture and presents it in a form your eyes can parse in seconds.
How It Works
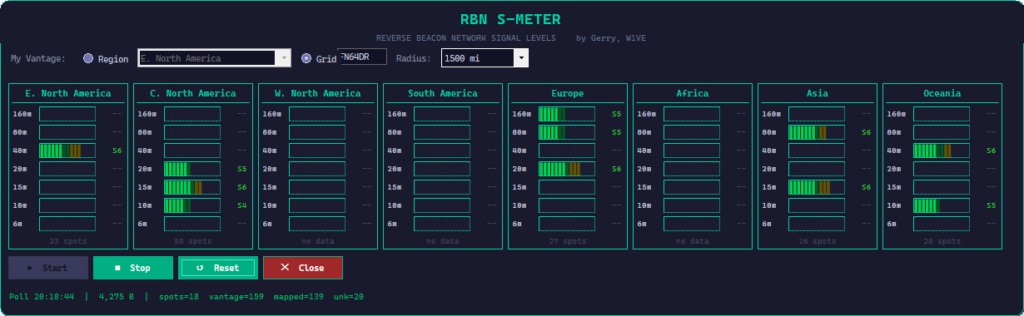
The key concept is your vantage point. You choose your region from a dropdown — say, “E. North America” — and the app polls the RBN live. It filters spots to those heard by skimmers near you, then aggregates signal levels by band and source region. The display updates in real time.
Update: User feedback that regions only were too big an area… a guy in Eastern Canada would be seeing data from clusters in Florida. So I updated the app to allow you to pick your grid square, and a radius distance to a spotter. You can choose a range from 250 to 2500 miles. The danger being if you pick a spotter radius that is too small, you might not see any data.
When you select your region, you’re asking: “What are skimmers located near me hearing, and where are those signals coming from?” The answer tells you exactly which DX paths are open from your part of the world — right now, on which bands, and at what strength.
Each region panel shows a band-by-band S-meter bar. The bar height and S-unit readout represent the median signal level across all qualifying spots, so a handful of loud signals don’t skew the picture. The spot count at the bottom of each panel tells you how much data is backing the reading — S7 on 17 spots is far more meaningful than S7 on 2.
What You See at a Glance
- Region selector — Pick your vantage point. All propagation data is then reported relative to your location.
- Band meters — 160m through 6m, one bar per band, with live S-unit readouts updated each poll cycle.
- World panels — Eight DX regions displayed simultaneously: E. and W. North America, C. North America, South America, Europe, Africa, Asia, and Oceania.
- Spot counts — Each panel shows how many RBN spots are driving the reading, so you know how much confidence to put in it.
- Status bar — Live poll timestamp, raw data volume, and spot/vantage/mapped statistics so you always know what the app is doing.
- No install required — Single standalone Windows x64 executable. No separate runtime, no registry entries.
A Practical Example
Say it’s late afternoon and you’re thinking about working some EU. You glance at the RBN S-Meter. The Europe panel shows 40m at S5 with 28 spots, 20m at S3 with 9 spots, and 15m completely dark. That tells you 40m is your best bet right now, 20m is marginal, and 15m isn’t worth your time. You tune to 40m, find a pile-up, and work it. No guesswork, no wasted time spinning the dial on a dead band.
Now flip it around: you want to know if 10m is open to Japan. Select your region, look at the Asia panel, check the 10m bar. Either it’s lit up or it isn’t. The RBN doesn’t lie.
Built for Radio Operators
This isn’t a general-purpose propagation tool dressed up in ham radio clothing. The RBN S-Meter was designed from the ground up for the way operators actually work — you need information fast, you need it to be accurate, and you don’t want to babysit a web browser while you’re at the rig. The UI is dense but readable, and the controls are minimal: Start, Stop, Reset, Close.
Future versions will bring deeper amateur radio integration, including hardware PTT key support, callsign-based station tagging, and repeater/linked system awareness. But for propagation assessment right now, the RBN S-Meter is ready to go.
RBN S-Meter is a free, standalone Windows x64 application. Download here.
(Latest update 4/17/26 01:20z)
73 de W1VE — comments and bug reports welcome.
6 thoughts to “An RBN S-Meter…”
Looks good Gerry. My comments are the following regarding relying on RBN to see if bands are open or not.
I have often found many of the RBN nodes taken down during contests while owners are participating that weekend. Many of these have excellent receive antennas that provide excellent SNRs when the band is open when the node is active. . This means that some areas may not have a working RBN that usually provides feedback leading to a false belief that conditions aren’t good to that particular area. This brings me to my second point about relying on RBN reports only. There’s a huge variety of antennas being used to receive signals at RBN nodes. Some are just wires. Some are verticals. Some are Beverages favoring one direction of another, etc.. So a low RBN SNR doesn’t necessarily mean the band is poor. Two recent examples . CQing on 10 meters yielded no RBN hits in Europe yet a station in Sardinia called me that was S9. There have also been numerous times where I’ve CQed on 160 meters and had zero RBN hits in Europe yet I was called by numerous strong signaled Europeans on TopBand after CQing a few times. SNR levels depend on the signal strength received as well as the QRN/QRM being received on or near the received signal frequency at that RBN location. The SNR can be showing as 3DB but my signal can actually be S9+. RBN is a great tool but it’s not always telling the truth. SNR and actual signal strength are different. Having said this I still want to try the “SNR” meter App as it definitely looks like an easier way to monitor RBN SNRs at a glance. Maybe it should be called RBN “SNR Meter”.
Thanks, Ken. Your comments greatly appreciated.
Looks quite useful although I don’t think there are more than a few skimmers that relate to my geographic location in Calgary. Western, and Central NA usually have very different propagation due mainly to latitude and magnetic declination.
The app is updated, Jerry. You can specify a grid square and a radius. So you can zoom in on the skimmers.
Gerry, this is a great idea! I downloaded the exe but it won’t run on my computer – getting an error that says: Unhandled exception has occured. The initializer for Microsoft.Data.SqliteConnection threw an exception.
Hi Gene — I have updated the app and it should be bulletproof now. Just delete what you have, re-download and try again.